527 Network Explorer
Project link: https://github.com/eric-mc2/527-explorer
527 Explorer
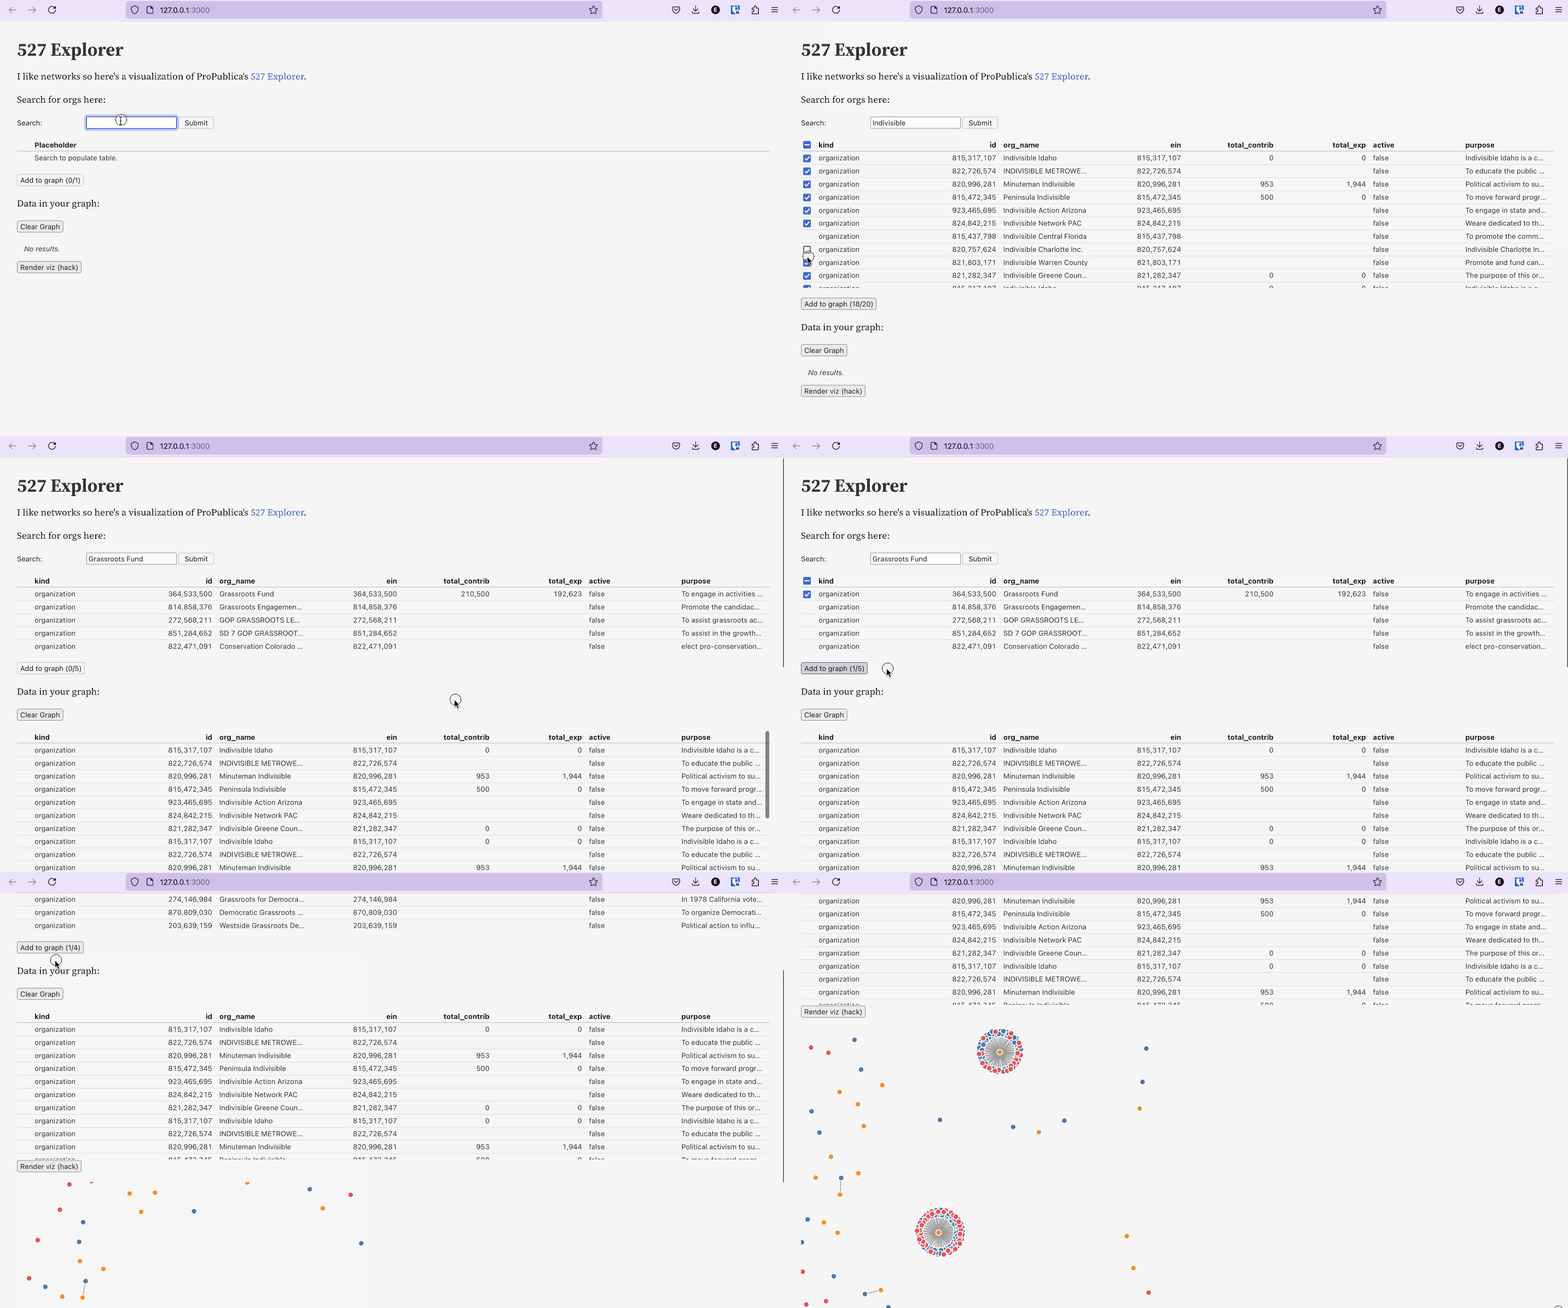
Network visualization of ProPublica’s 527 Explorer, built with Observable Framework.
Demo
(so far …)

Why make this?
This project is in part, an extension of my prior research into nonprofit donations networks.
I would like to write my own opinionated d3.js layout that deals with the scale-free and core-periphery characteristics of these networks. Having code to query and visualize a donations dataset was a first step.
I also have ambitions to create better looking interactive visualizations, and was curious by the interactivity provided by Observable.