DNC Transit Effect? (Part 2)
Project link: https://github.com/eric-mc2/DNCTransit
This research project asks:
Does the exogeneous shock of the 2024 Democratic National Convention in Chicago induce significant impacts on public transit usage?
In a previous post, I collected Chicago open transit data and designed a quasi-experiment to measure the causal impact of the DNC on ridership.
Regression
Now for the results …
Fixed Effects Model
The fixed effects specification conveniently eliminates static sources of bias without needing to explicitly measure each and every static variable (in other words it controls for all time-invariant unobserved factors). If we believe we have controlled for dynamic factors, such that all other time-varying factors are uncorrelated with the treatment variable, then the FE model gives us an unbiased causal estimate of the treatment effect.
The equation includes an indicator for “during DNC”, day-of-the-week dummies, time trend, and unit fixed effects:
$$ \log(\text{rides}_{it}) \sim \beta_0 + \beta_1\text{DNC}_t + \beta_2 \text{dotw}_t + \beta_3 t + \alpha_i $$The convenience of FE is also a downside: many helpful covariates, including the treatment “indicator”, distance to DNC, do not vary with time. These factors get subsumed in the unit fixed effect term \(\alpha_i\), meaning we can’t estimate them separately. Without being able to isolate the location of the DNC, this model only speaks to city-wide effects during the DNC.
With this major caveat in mind, let’s run the model (separate models per transit mode1):
| FE (Uber) | FE (Train) | FE (Bike) | |
|---|---|---|---|
| During DNC | -0.0524*** | -0.0814*** | 0.0297*** |
| (0.0066) | (0.0148) | (0.0069) | |
| time trend | 0.0013*** | 0.0014*** | -0.0000 |
| (0.0001) | (0.0002) | (0.0001) | |
| Tuesday | 0.1059*** | 0.1098*** | 0.0274*** |
| (0.0047) | (0.0105) | (0.0051) | |
| Wednesday | 0.2156*** | 0.1172*** | 0.1199*** |
| (0.0047) | (0.0105) | (0.0051) | |
| Thursday | 0.3314*** | 0.0893*** | 0.0794*** |
| (0.0047) | (0.0105) | (0.0051) | |
| Friday | 0.5977*** | 0.0530*** | 0.1148*** |
| (0.0047) | (0.0106) | (0.0051) | |
| R-squared | 0.9505 | 0.9019 | 0.9470 |
| R-squared Adj. | 0.9497 | 0.9003 | 0.9458 |
| N | 64229.0 | 7910.0 | 49697.0 |
The results show a -5.1%, -7.8%, and +3.0% percentage point change in uber, train, and bike ridership during the DNC compared to other summer days. This supports the hypothesis that the anticipated traffic suppressed city-wide mobility (except for bikes which are less affected by traffic).
Difference in Difference
Like fixed effects, the difference in difference model removes bias of time-invariant unobserved factors. Unlike fixed effects, we can include time-invariant observed factors into the model. Additionally, diff-in-diff removes bias from dynamic factors that follow common time-trends between treatment and control groups.
The difference in difference model isolates both the area and time of the DNC. First it compares pre/post among the control group.
$$\Delta \text{not nearby} = E(\text{rides} | \text{not nearby}, \text{during DNC}) - E(\text{rides} | \text{not nearby}, \text{not during DNC})$$Then it compares pre/post among the treatment group.
$$\Delta \text{nearby} = E(\text{rides} | \text{nearby}, \text{during DNC}) - E(\text{rides} | \text{nearby}, \text{not during DNC})$$Finally it takes the difference of these comparisons: the change in treatment group vs the change in control group.
$$\text{DiD} = \Delta \text{nearby} - \Delta \text{not nearby} $$In the formal2 model I include time trend, day-of-the-week dummies, distance to nearest transit, and quadratic lat/long terms3.
$$ \log{rides_{it}} \sim \beta_0 + \beta_1 \text{DNC}_t + \beta_2 \text{nearby}_i + \beta_3 \text{DNC}_t \text{nearby}_i + X_{it} + u_{it} $$| DiD (Uber) | DiD (Train) | DiD (Bike) | |
|---|---|---|---|
| Near DNC | 0.7979*** | -0.7937 | 0.4222*** |
| (0.2357) | (0.5147) | (0.1244) | |
| During DNC | -0.0666*** | -0.1221*** | -0.0335 |
| (0.0143) | (0.0146) | (0.0240) | |
| Near DNC:During DNC | 0.1845** | 0.8550 | 0.2998*** |
| (0.0810) | (0.5248) | (0.0555) | |
| log(dist to train) | -0.3231*** | -0.1238*** | |
| (0.0563) | (0.0215) | ||
| log(dist to bike) | -0.2997*** | 0.2345 | |
| (0.0553) | (0.1478) | ||
| log(dist to bus) | -0.0108 | -0.0730 | 0.0236 |
| (0.0450) | (0.0667) | (0.0275) | |
| R-squared | 0.5109 | 0.2943 | 0.6597 |
| R-squared Adj. | 0.5108 | 0.2929 | 0.6596 |
| N | 64231.0 | 7910.0 | 49704.0 |
These results show a baseline difference in transit usage between convention and non-convention areas. In the control group we observe a (non-causal) -6.4%, -11.5%, -3.3% (NS) percentage-point change in rideshare, train, and bike rides, which agrees directionally with the fixed-effects model. The causal effect of the DNC on rideshares, train, and bike rides near the DNC is a +20.3%, +135.1%, and +35.0% percentage-point change.
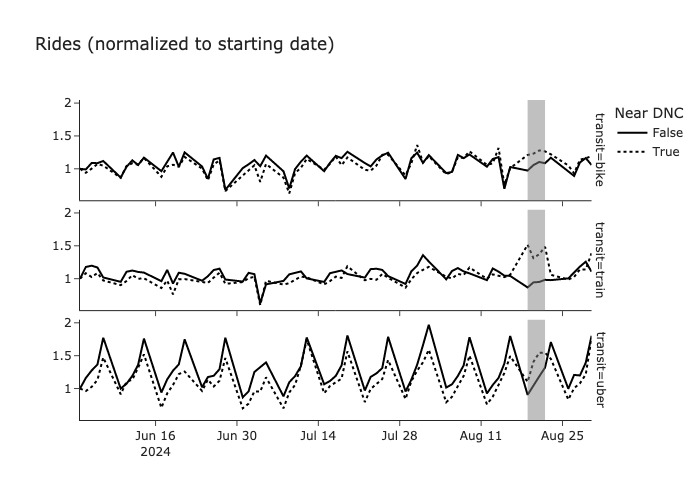
Parallel Trends
The diff-in-diff model operates on the “parallel trends” assumption: the control group and (unobserved) counterfactual treatment group must have similar slopes during the treatment period. In practice, since we cannot observe the counterfactual group, we check whether the treatment and control groups have similar slopes prior to treatment. And we ask “do we believe this relationship would hold in the next period”?
Plotting pre-treatment rides, the group trends are very consistent in the long-term and even show similar patterns on a weekly scale. We also don’t see any anticipatory effects leading up to the DNC event.
Conclusion
Areas near the DNC experience +20.3%, +135.1%, and +35.0% higher ridership (for rideshares, train, and bikes) compared to non-convention areas due to the DNC. This amounts to roughly4 24k, 62k, and 3k extra rides.
We also observe that ridership in non-convention areas fell during the DNC by -6.4%, -11.5%, and +3.3% compared to their pre-DNC baseline. A loss of roughly 43k, 143k, and 3k rides. This loss cannot be interpreted as the causal result of the DNC in particular.
Overall the evidence suggests that DNC attendees did in fact use and prefer public transit during their stay in Chicago. However, the event itself (and anticipated traffic) may have suppressed mobility by an even greater extent across Chicago.
Though we can easily measure what happened during the DNC, the counterfactual without the DNC is unknowable. Counterfactuals are important in policy because they provide a second-best outcome upon which to base our decision (hosting the DNC vs not hosting). These quasi-experimental methods, Fixed Effects and Difference-in-Difference regression, make a principled estimate of the counterfactual outcome, providing a point of comparison for the effect of the DNC itself.
In the next post, I list the prevailing issues with my regression design and propose an adjustment to compellingly overcome the worst issue.
Footnotes
-
Estimated with weighted least squares (weighted by number of observations per unit) with clustered standard errors per unit. ↩︎
-
Omitted for visual clarity. ↩︎
-
Estimated total impact calculated as:
$$\Delta \text{rides} = (e^\beta - 1) * E(\text{rides}_{it} | \text{Near DNC}_i * \text{Before DNC}_t) * \sum{\text{Near DNC}_i * \text{During DNC}_t}$$ ↩︎