DNC Transit Study
Top-Line Result:
Chicago hosted the 2024 Democratic National Convention from August 19-22, with official events primarily at the United Center and McCormick Place. Over those four days, 64,000 train rides, 148,000 rideshares, and 10,000 bikeshares occurred in proximity to the venues, of which 22,000 train rides, 41,000 rideshares, and 3,000 bikeshares can be attributed to the convention. There is no evidence that convention-goers preferred any transit mode at different rates than baseline commuters.
Introduction
This project aims to measure the partial economic impact of the 2024 Chicago Democratic National Convention. Major spotlight events such as the DNC, the NFL draft, or on a greater scale the Olympics, promise “once-in-a-generation opportunities for job creation” to constituents 1, and raise the profile of a city on the national and global stage. Balancing these promises, events face local pushback for expropriating public spaces for long periods and to deliver meaningful engagement with local economies. What incentives a city should offer a major corporation, such as Amazon2 or the Bears, for a more permanent investment are a related, and under-studied thread.


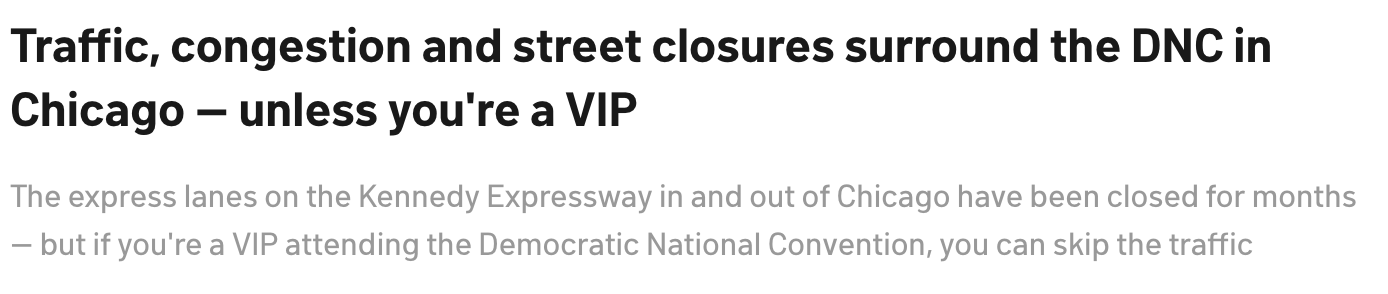
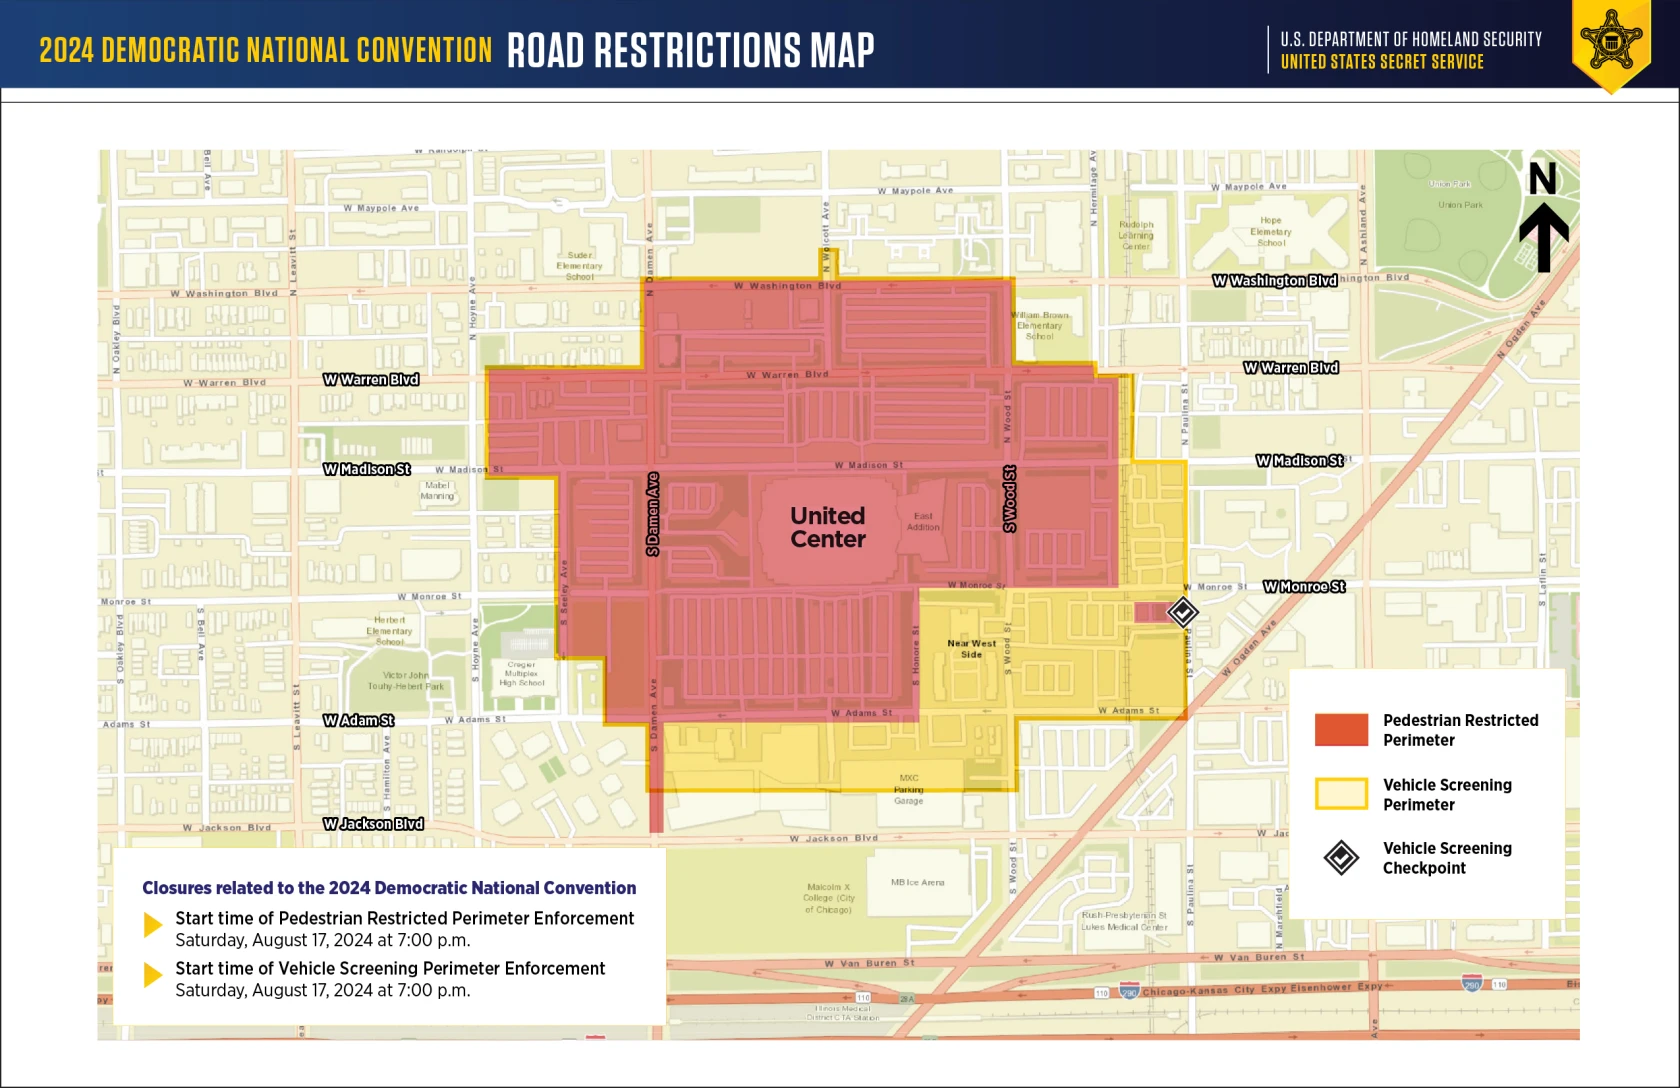
In the case of the DNC, much of the local conversation anticipated interruptions due to the heightened security perimeter surrounding the event spaces, which cordoned off several blocks (182 acres) to pedestrian and vehicular traffic. Residents and businesses inside the perimeter expected security checks and decreased foot traffic, while city-wide residents expected backups along I-290 and leading to the I-90 / I-290 interchange.

Chicago’s voting history as a Democratic stronghold and its location among Midwestern battleground states were cited as primary factors to enter and win its convention bid3. Other cities under consideration included Atlanta, Houston and New York City. Chicago’s hospitality sector, public transportation, venue capacity, and logistics also gave it an edge up4. With President Biden still seeking re-election at the time of the decision, his achievement with the Bipartisan Infrastructure Law was also at the top of the conversation and political platform for the upcoming election.
Viewing the DNC as a major tourism event promising an economic lift and highlighting green urban solutions, my research question focuses on convention-goer’s transit choices (Uber vs public transit). I employ standard methods from econometrics and social science, validating attendence figures from the official impact report, and extending its environmental sustainability analysis.
Does the exogeneous shock of the 2024 Democratic National Convention in Chicago significantly impact mobility?
A secondary goal of this project was to experientially5 learn about statistical modeling in a policy setting. By design, this experiment is a win-win. If a significant result is found, that’s interesting. If no significant result is found, that could be interesting too, especially results like “DNC touts green infrastructure, favors Ubers to convention”. Finally, if the experiment or data is insufficient, that’s a learning opportunity to design and evaluate better experiments in the future
Data
The panel dataset in this project represents daily ridership per transit station. I pulled ridership data from the City of Chicago, CTA, RTA, and Divvy data portals to include as many transit modes as possible, finally using train, Uber (rideshare), and Divvy (bike) data. Unfortunately I could not find (or afford) walking or driving data, and public bus and commuter rail data were too coarse to use. In this writeup I’ll say “Uber” as a short-hand for all rideshare operators.
Train ridership is available as daily station counts of passenger entries. Bike data is available as individual trip-level rows, including exact start and end times and start and end points. To match the granularity of train data, I aggregated these to daily station (bike dock) counts of trip start-points and endpoints. Uber data is available as individual trip-level rows, including exact start and end times and coded by census tract. I aggregated this data to daily tract counts of start-points and endpoints. To retain a fuller picture of transit patterns, I kept and consolidated start and end points so that all transit modes describe daily rides visiting an area. The train data is comparatively under-counted in this setup. For modeling, I kept each transit mode in its natural geometry (fixed train station points, fixed bike dock points, uber census tracts).6
| Modality | Included/Excluded | Challenges |
|---|---|---|
| Train | x | easy (Socrata API / sodapy) |
| Uber/Lyft | x | medium (300M rows; query optimization) |
| Divvy (bikes) | x | hard (gps drift; unstable ids) |
| Bus | too coarse | |
| Metra (commuter rail) | too coarse | |
| Walking / Biking | vendored/unavailable | |
| Driving | vendored/unavailable |
Geographic data came from:
- transit routes and stops (Socrata API / sodapy)
- Census tracts (pygris)
- Building footprints (Socrata API / sodapy)
- DNC security perimeter (hand-drawn polygons)
Observed Data and Treatment “Selection”
The panel constitutes the DNC dates (August 18 - 21), plus three months’ prior, capturing baseline summertime transit patterns. I compute the distance of each transit stop and tract centroid to the United Center and McCormick Place buildings. Any point within a mile of the building or any tract at least 50% within the mile buffer is considered part of the treatment group. All other train stations, bike docks, and census tracts within the Chicago city limits are considered part of the control group.
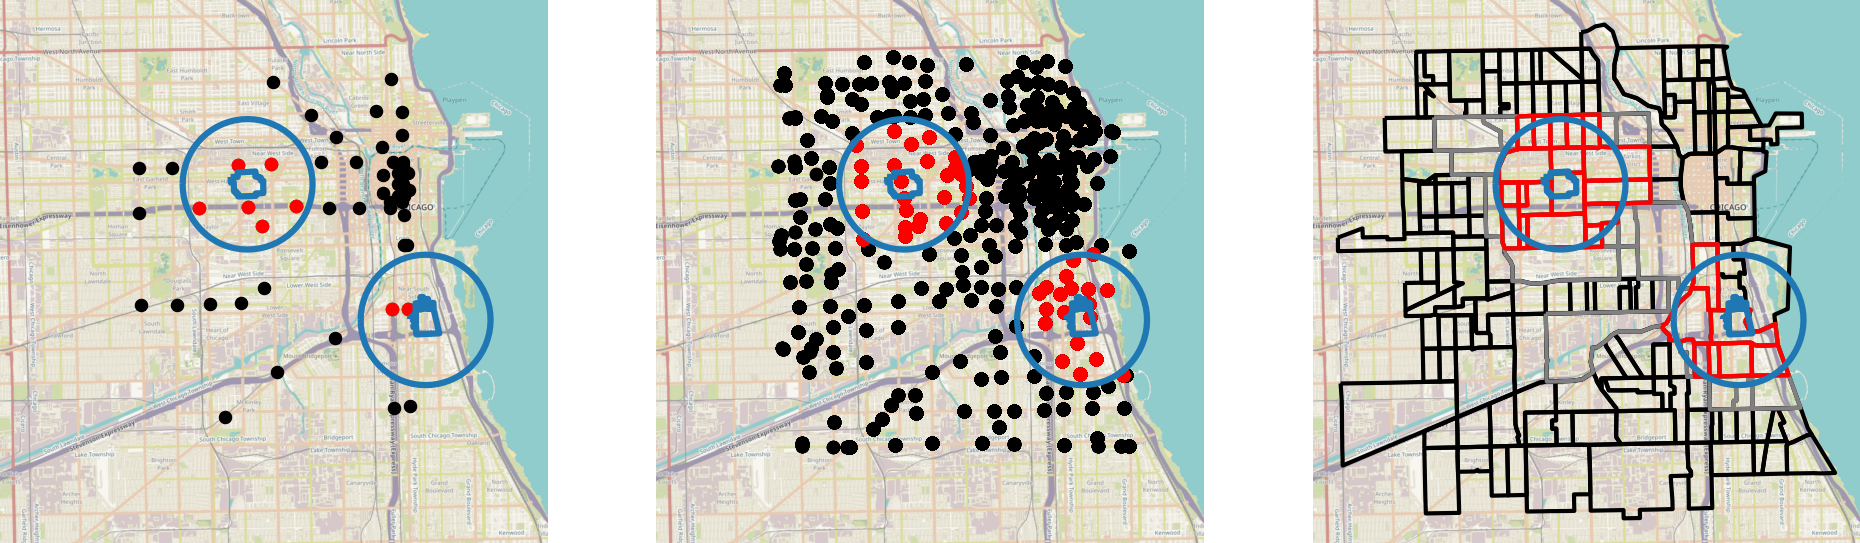
Red = treatment group. Black = control group. Gray = marginal tracts.
| bike Control | Treated | train Control | Treated | uber Control | Treated | |
|---|---|---|---|---|---|---|
| N units | 1549 | 47 | 134 | 8 | 1232 | 25 |
| N unit-days | 76244 | 4552 | 13132 | 714 | 96851 | 2446 |
| N pre | 73081 | 4380 | 12596 | 682 | 92950 | 2346 |
| N post | 3163 | 172 | 536 | 32 | 3901 | 100 |
| Mean log(rides) (pre) | 2.598 | 3.582 | 7.306 | 7.039 | 3.829 | 5.677 |
| Mean log(rides) (post) | 2.579 | 3.887 | 7.35 | 7.386 | 3.702 | 5.78 |
| % complete panel | 0.274 | 0.809 | 1 | 0.875 | 0.557 | 0.88 |
Power Analysis
Back of the Envelope
A look at the raw transit counts helped specify the design units and treatment designation. According to the official DNC impact report, 50,000 delegates visited and spent $58.7M city-wide. Is this exogeneous shock large enough to be statistically observable? Yes, by narrowing the region in which we assume it will have a direct effect. If we assume the shock is evenly distributed across the whole city, it would not be observable, as daily aggregate CTA train ridership is 589,000 +/- 178,000. Considering train routes passing through DNC venues, the signal-to-noise ratio improves, since those routes serve 189,000 passengers per day. Finally, the exogeneous shock ought to be quite noticeable compared to the specific train stations, tracts (Uber rides), and bike stations nearest the venues, as these serve 11,000, 33,000, and 6,000 daily passengers respectively – far fewer than the 50,000 additional expected passengers. By this back-of-the-envelope math, type II errors are avoidable if “treatment” is defined in this way.
Minimum Detectable Effect
Turning to a more formal analysis. I compute the minimal detectable effect size (MDE) by estimating the classic 2x2 difference-in-difference contrasts. To express the minimal detectable exogeneous shock, I multiply by the pre-treatment baseline outcome and number of treatment days.
$$\hat \beta = (\overline{logy}_{1,1} - \overline{logy}_{1,0}) - (\overline{logy}_{0,1} - \overline{logy}_{0,0}) $$$$ \text{MDE}_{\%} = \exp(z_{1-\alpha/2} + z_{1-power}) \exp(SE(\hat \beta)) - 1 $$
$$ \text{MDE}_{\text{total}} = \text{MDE}_{\%} * \bar y_{1,0} * T_{\text{treat}} $$
The difference in difference comparison yields more statistical power than the back of the envelope calculation. Assuming most delegates use these three observable transit modes, their arrivals far exceed the statistical type II threshold.
Regression Model
For the main regression specification, I use a difference-in-difference model with two-way fixed effects,
$$\log y_{it} = \beta_1 D_{it} + \beta_2 D_{it} M_i + \alpha_i + \gamma' t M_i + \epsilon_{it} \tag{1}$$where \(y_{it}\) are the number of rides, \(D_{it}\) is the treatment indicator for unit i at time t, \(M_i\) indicates the transit mode, \(\alpha_i\) are unit fixed effects, \(\gamma' t M_i\) are time fixed effects interacted with transit mode, and \(\epsilon_{it}\) is the idiosyncratic error term. Standard errors are clustered two ways per unit and per timestep7.
Conceptually, diff-in-diff models proceed in three stages. First, the model measures how the control group changes over time. Second, the model measures how the treatment group changes over time. Third, it compares the two group’s changes. If the treatment group changes much more or much less than the control group, then the model rejects the null hypothesis. If the two groups’ trajectories are similar, then the model fails to reject the null hypothesis.
The fixed effect terms in the equation above exploit the panel data structure (repeated observations of a fixed sample) and ensure that each unit is compared to itself and the group average, accountingn for the fact that different transit modes and different units have different absolute ridership levels (e.g. central business district traffic is much higher than residential). The time x transit fixed effects controls for transit-specific daily shocks (such as service outages or weather) which differently affect different transit modes.
Parallel Trends
To first order, both treatment and control are flat in the pre-event period. The two groups also follow each other’s high-frequency variation pretty closely. The identifying assumption of difference in difference model is parallel linear trends in the pre period. Averaging out the high-frequency variation, this is definitely satisfied.
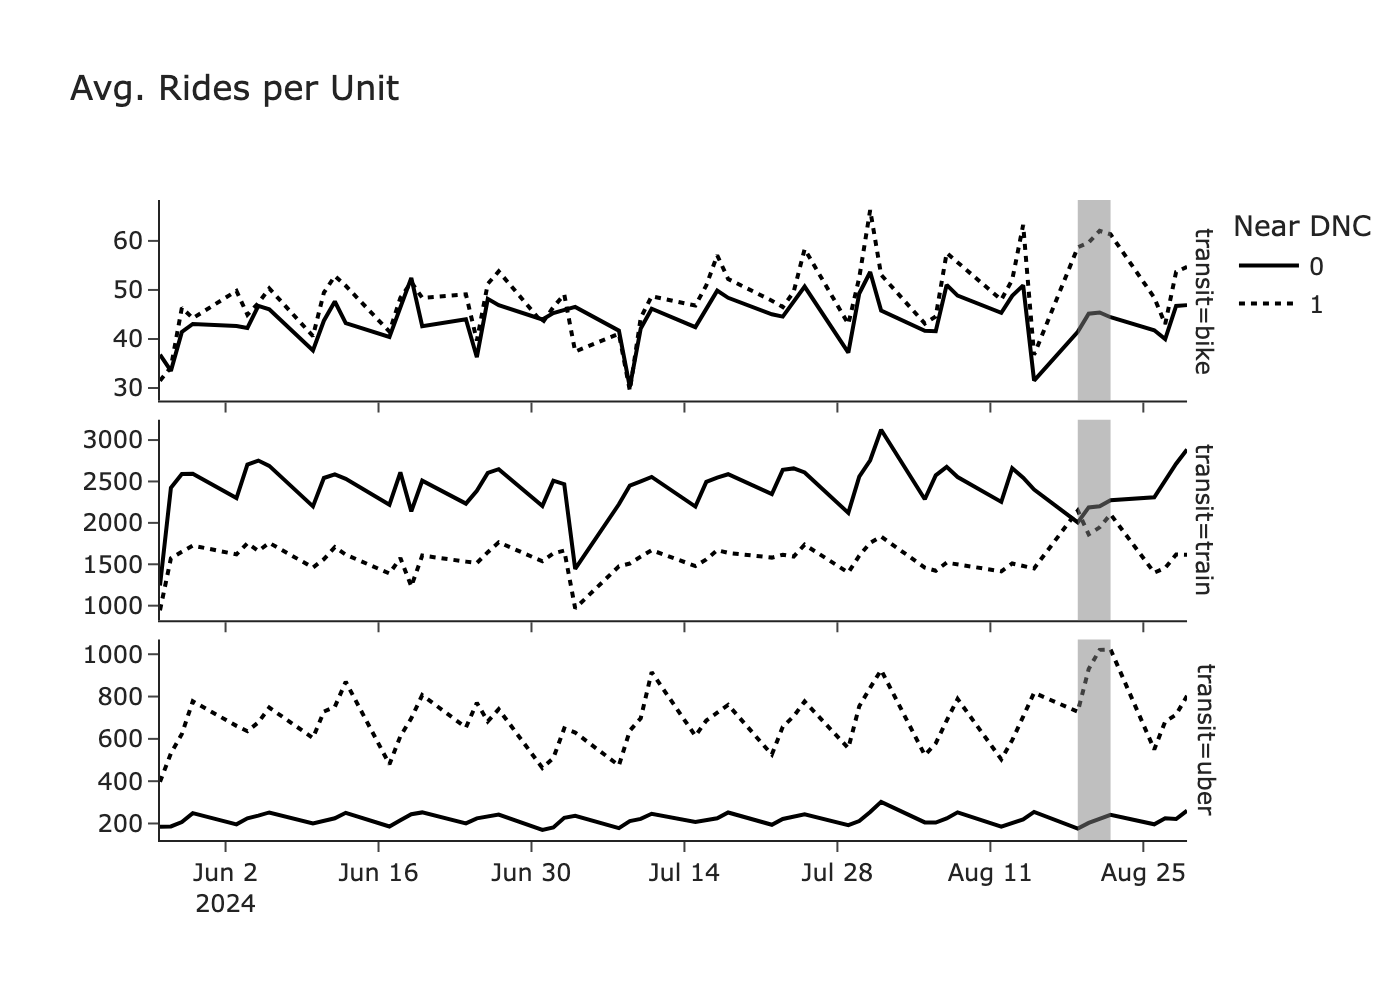
The impact of the DNC is visible during the event period, where the group trends diverge, but the magnitude of this change is on par with the typical high-frequency variation of the time series. This begs the question if spurious effects exist in the pre-period, and if the event period is also coincidentally ‘significant’. I test this condition with a placebo test in a following section of the report.
Results
The effect of the DNC on ridership was a 53%, 39%, and 32% increase across train, Ubers, and bikeshares. Compared to each mode’s own baseline, each increase is statistically significant. However, despite the point estimates being far apart, the estimates have a high variance so the between-mode comparison is not significant.
These percentage changes translate to an aggregate increase of 22,000 train rides, 41,000 Uber rides, and 3,000 bike rides near DNC venues and during the event. As noted in the introduction, these are a fraction of the raw observed rides, or even the observed week-over-week change, because this method nets out the baseline venue traffic and any common city-wide shocks to traffic during the event.
| log(rides) | |
|---|---|
| (1) | |
| coef | |
| treat | 0.328** (0.114) |
| treat × mode × × bike | -0.052 (0.118) |
| treat × mode × × train | 0.097 (0.171) |
| fe | |
| unit FE | yes |
| time x transit FE | yes |
| stats | |
| Observations | 110,026 |
| R2 | 0.964 |
| Significance levels: * p < 0.05, ** p < 0.01, *** p < 0.001. Format of coefficient cell: Coefficient (Std. Error) | |
Robustness Checks
Model Specifications
I run a battery of alternative specifications by changing the model, the control group composition, the treatment group composition, and dropping potential confounders. Regression results are presented in the next table.
- The main model (Eq 1).
- A more parsimonious fixed effect structure (Eq 2) that pushes transit-specific shocks into the treatment term.
- Drops the CTA Green Line Damen station from the panel.
- Label all census tracts that intersect the venue buffer as “treated”.
- Drop all units except those within 1 mile of the United Center, McCormick Place, Wrigley Field, Soldier Field, and Rate Field.
- Specification 2, 3, 4, and 5 combined.
Motivating (3), this station re-opened on August 5 after being shuttered for 75 years. The timing of the re-opening, one week before the DNC, allows a short baseline estimation, but could still confound the results. This station is the closest stop to the United Center, so dropping it significantly attenuates the treatment effect. Motivating (4), the goal is to capture more relevant units and traffic that might be affected by the event, and to increase the treated sample size. Traffic through these units may be unrelated to the DNC, and could affect the result in the positive or negative direction.On the other extremen, only 3 tracts are 100% contained in the venue radius. Motivating (5), the goal is to capture a more apt control group by restricting the sample to other major sporting venues.
| log(rides) | ||||||
|---|---|---|---|---|---|---|
| (1) | (2) | (3) | (4) | (5) | (6) | |
| coef | ||||||
| treat | 0.328** (0.114) |
0.311** (0.116) |
0.328** (0.114) |
0.235** (0.082) |
0.346** (0.111) |
0.161 (0.084) |
| treat × mode × × bike | -0.052 (0.118) |
-0.010 (0.131) |
-0.052 (0.118) |
0.041 (0.089) |
-0.206 (0.139) |
0.084 (0.107) |
| treat × mode × × train | 0.097 (0.171) |
0.032 (0.182) |
-0.004 (0.167) |
0.190 (0.151) |
0.063 (0.171) |
0.032 (0.156) |
| fe | ||||||
| unit FE | yes | yes | yes | yes | yes | yes |
| time FE | - | yes | - | - | - | yes |
| time x transit FE | yes | - | yes | yes | yes | - |
| stats | ||||||
| Observations | 110,026 | 110,026 | 110,010 | 110,026 | 13,127 | 13,111 |
| R2 | 0.964 | 0.963 | 0.964 | 0.964 | 0.955 | 0.952 |
| Significance levels: * p < 0.05, ** p < 0.01, *** p < 0.001. Format of coefficient cell: Coefficient (Std. Error) | ||||||
All alternatives retain a statistically significant main effect except (6). The total effect (CATE) for train remains significant for all models except (6). The total effect for bikes remains significant for all models except (5). All alternatives retain the null result comparing transit modes.
Placebo Test
For a final robustness check, I re-run the main specification (1), marking each pre-treatment week as a virtual treatment period. The main effect exceeds each placebo estimate in absolute value and at least a 20% spread. Lending confidence to the result.
| log(rides) | |||||||||||||
|---|---|---|---|---|---|---|---|---|---|---|---|---|---|
| Week -0 | Week -1 | Week -2 | Week -3 | Week -4 | Week -5 | Week -6 | Week -7 | Week -8 | Week -9 | Week -10 | Week -11 | Week -12 | |
| (1) | (2) | (3) | (4) | (5) | (6) | (7) | (8) | (9) | (10) | (11) | (12) | (13) | |
| coef | |||||||||||||
| treat | 0.328** (0.114) |
0.057 (0.059) |
0.002 (0.040) |
0.066 (0.056) |
-0.068* (0.033) |
-0.103* (0.049) |
0.001 (0.030) |
-0.082* (0.035) |
-0.010 (0.036) |
-0.007 (0.036) |
0.030 (0.049) |
-0.030 (0.027) |
-0.081 (0.055) |
| treat × mode × × bike | -0.052 (0.118) |
-0.016 (0.064) |
0.024 (0.028) |
0.049 (0.040) |
0.106* (0.041) |
0.172*** (0.049) |
-0.128 (0.070) |
-0.109 (0.079) |
-0.036 (0.065) |
-0.046 (0.034) |
-0.012 (0.042) |
0.015 (0.028) |
-0.092 (0.048) |
| treat × mode × × train | 0.097 (0.171) |
-0.142 (0.071) |
-0.078 (0.066) |
-0.108 (0.058) |
0.040 (0.042) |
0.092 (0.056) |
-0.034 (0.037) |
0.063 (0.049) |
-0.001 (0.045) |
-0.083 (0.048) |
-0.070 (0.053) |
0.055 (0.041) |
0.094 (0.055) |
| fe | |||||||||||||
| unit | yes | yes | yes | yes | yes | yes | yes | yes | yes | yes | yes | yes | yes |
| time x transit | yes | yes | yes | yes | yes | yes | yes | yes | yes | yes | yes | yes | yes |
| stats | |||||||||||||
| Observations | 110,026 | 110,026 | 110,026 | 110,026 | 110,026 | 110,026 | 110,026 | 110,026 | 110,026 | 110,026 | 110,026 | 110,026 | 110,026 |
| R2 | 0.964 | 0.964 | 0.964 | 0.964 | 0.964 | 0.964 | 0.964 | 0.964 | 0.964 | 0.964 | 0.964 | 0.964 | 0.964 |
| Significance levels: * p < 0.05, ** p < 0.01, *** p < 0.001. Format of coefficient cell: Coefficient (Std. Error) | |||||||||||||
Discussion
This study estimates the causal effect of the 2024 Chicago Democratic National Convention on transit usage. It recovers a significant proportion of the pre-post difference in rides (e.g. week-over-week changes), but takes care to rule out confounding variables that affect ridership. To do so, these methods impose a limited scope, and only produce a causal estimate for a small part of the city, even though the event possibly had a larger footprint.
The parallel trends test, placebo test, and alternate specifications all give credibility to the internal validity of the results. The external validity is weaker since the event city and venues were specifically selected and designed to accomodate crowds. While accurate in attributing impacts to this specific event, the results do not necessarily generalize to other cities or event spaces.
-
https://democrats.org/news/dnc-announces-chicago-to-host-2024-democratic-national-convention/ ↩︎
-
https://www.buzzfeednews.com/article/leticiamiranda/amazon-hq2-finalist-cities-incentives-airport-lounge ↩︎
-
https://www.duckworth.senate.gov/news/in-the-news/how-chicago-landed-the-2024-democratic-national-convention ↩︎
-
https://www.nytimes.com/2023/04/11/us/politics/democratic-national-convention-chicago.html ↩︎
-
I describe the panel data preparation in more detail here. ↩︎
-
I test variations of this model in the robustness section. ↩︎